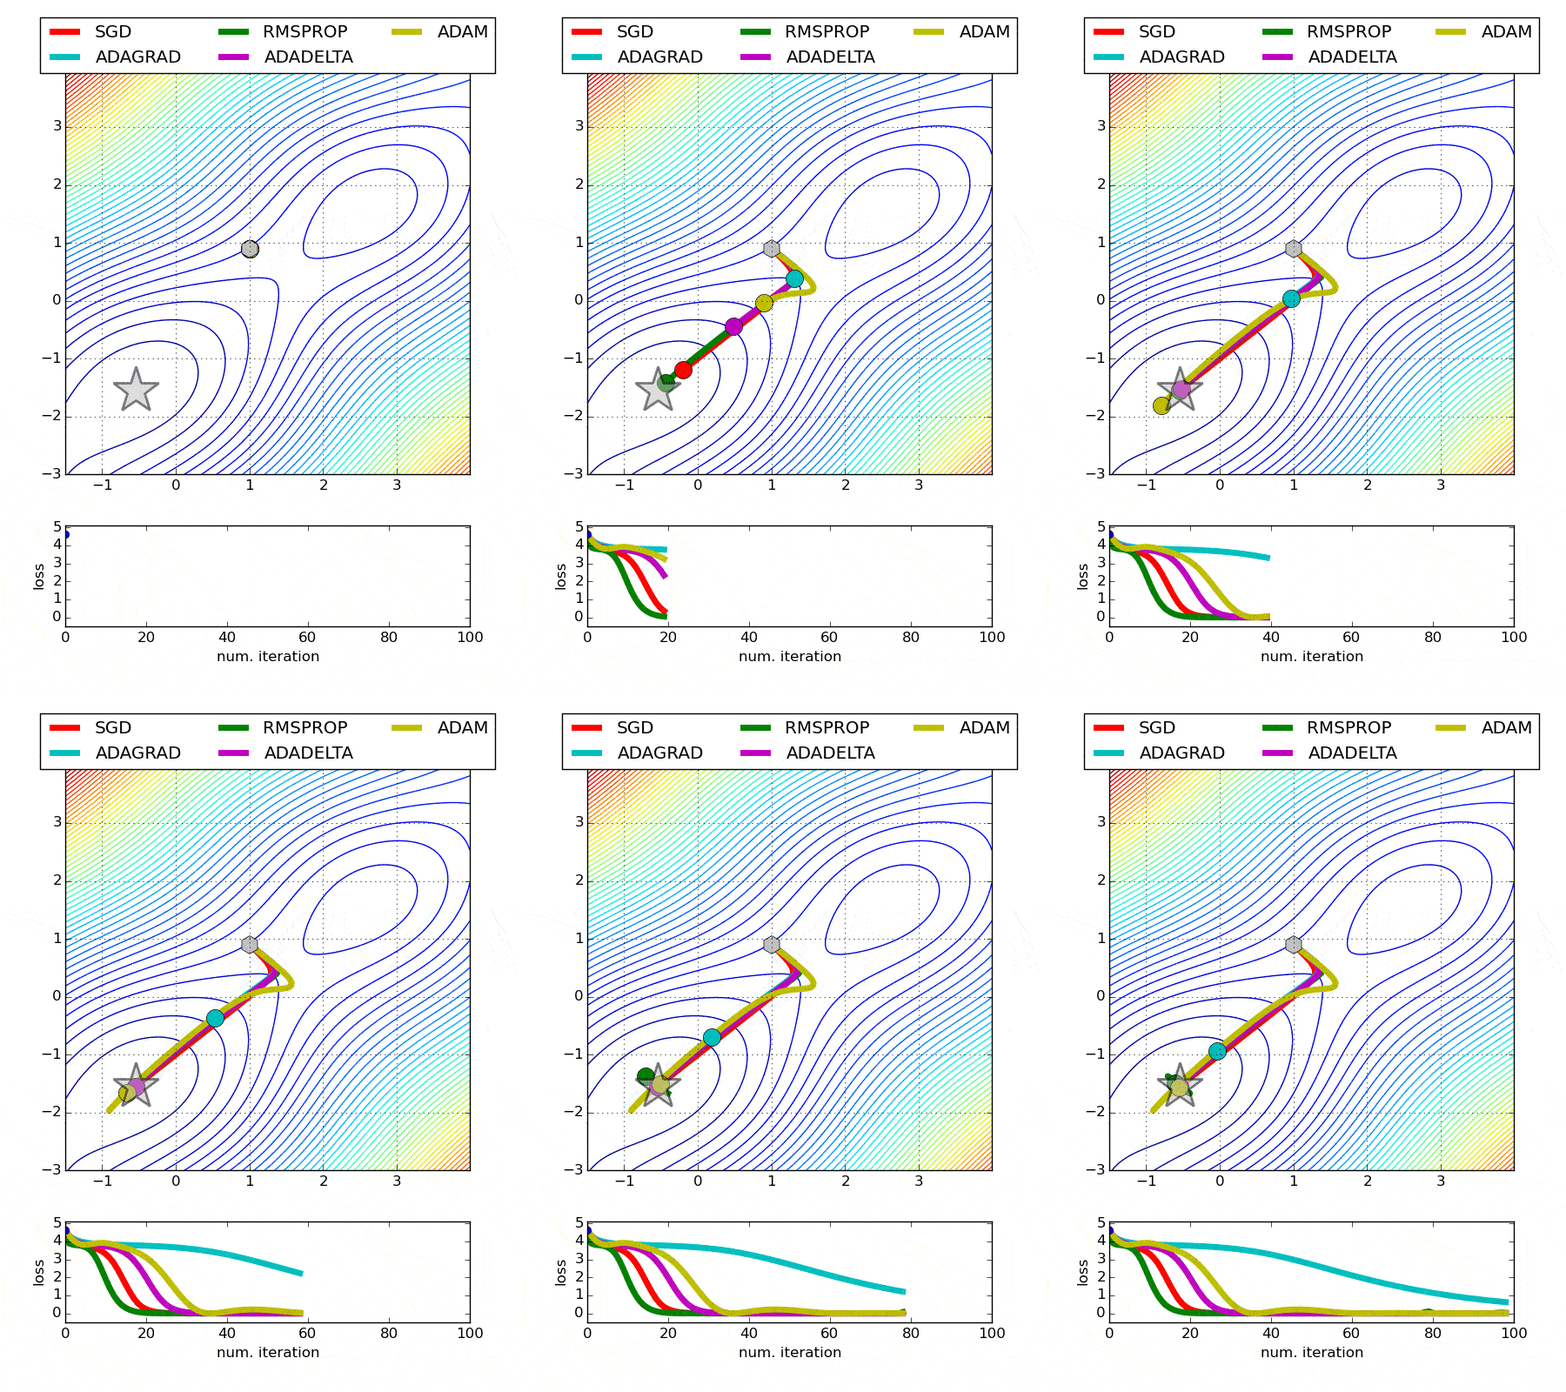
Code can be found on my github or here, you need to install autograd to execute it.
Usage: run
python plot_opt.py -f <func_name> -x <x_init> -y <y_init> -l <learning_rate> --use_momentum
other options please see the descriptions in plot_opt.py, and you can also add customized functions to functions.py following the formats.
Example: McCormick function

